A research-driven dashboard simplifying solar adoption through personalized education, financial evaluation, and AI-powered guidance.
Solar Energy
Financial Modeling
Interactive Dashboard
AI-Driven UX
Organization
University of Washington & Microsoft Research
Role
Product Designer
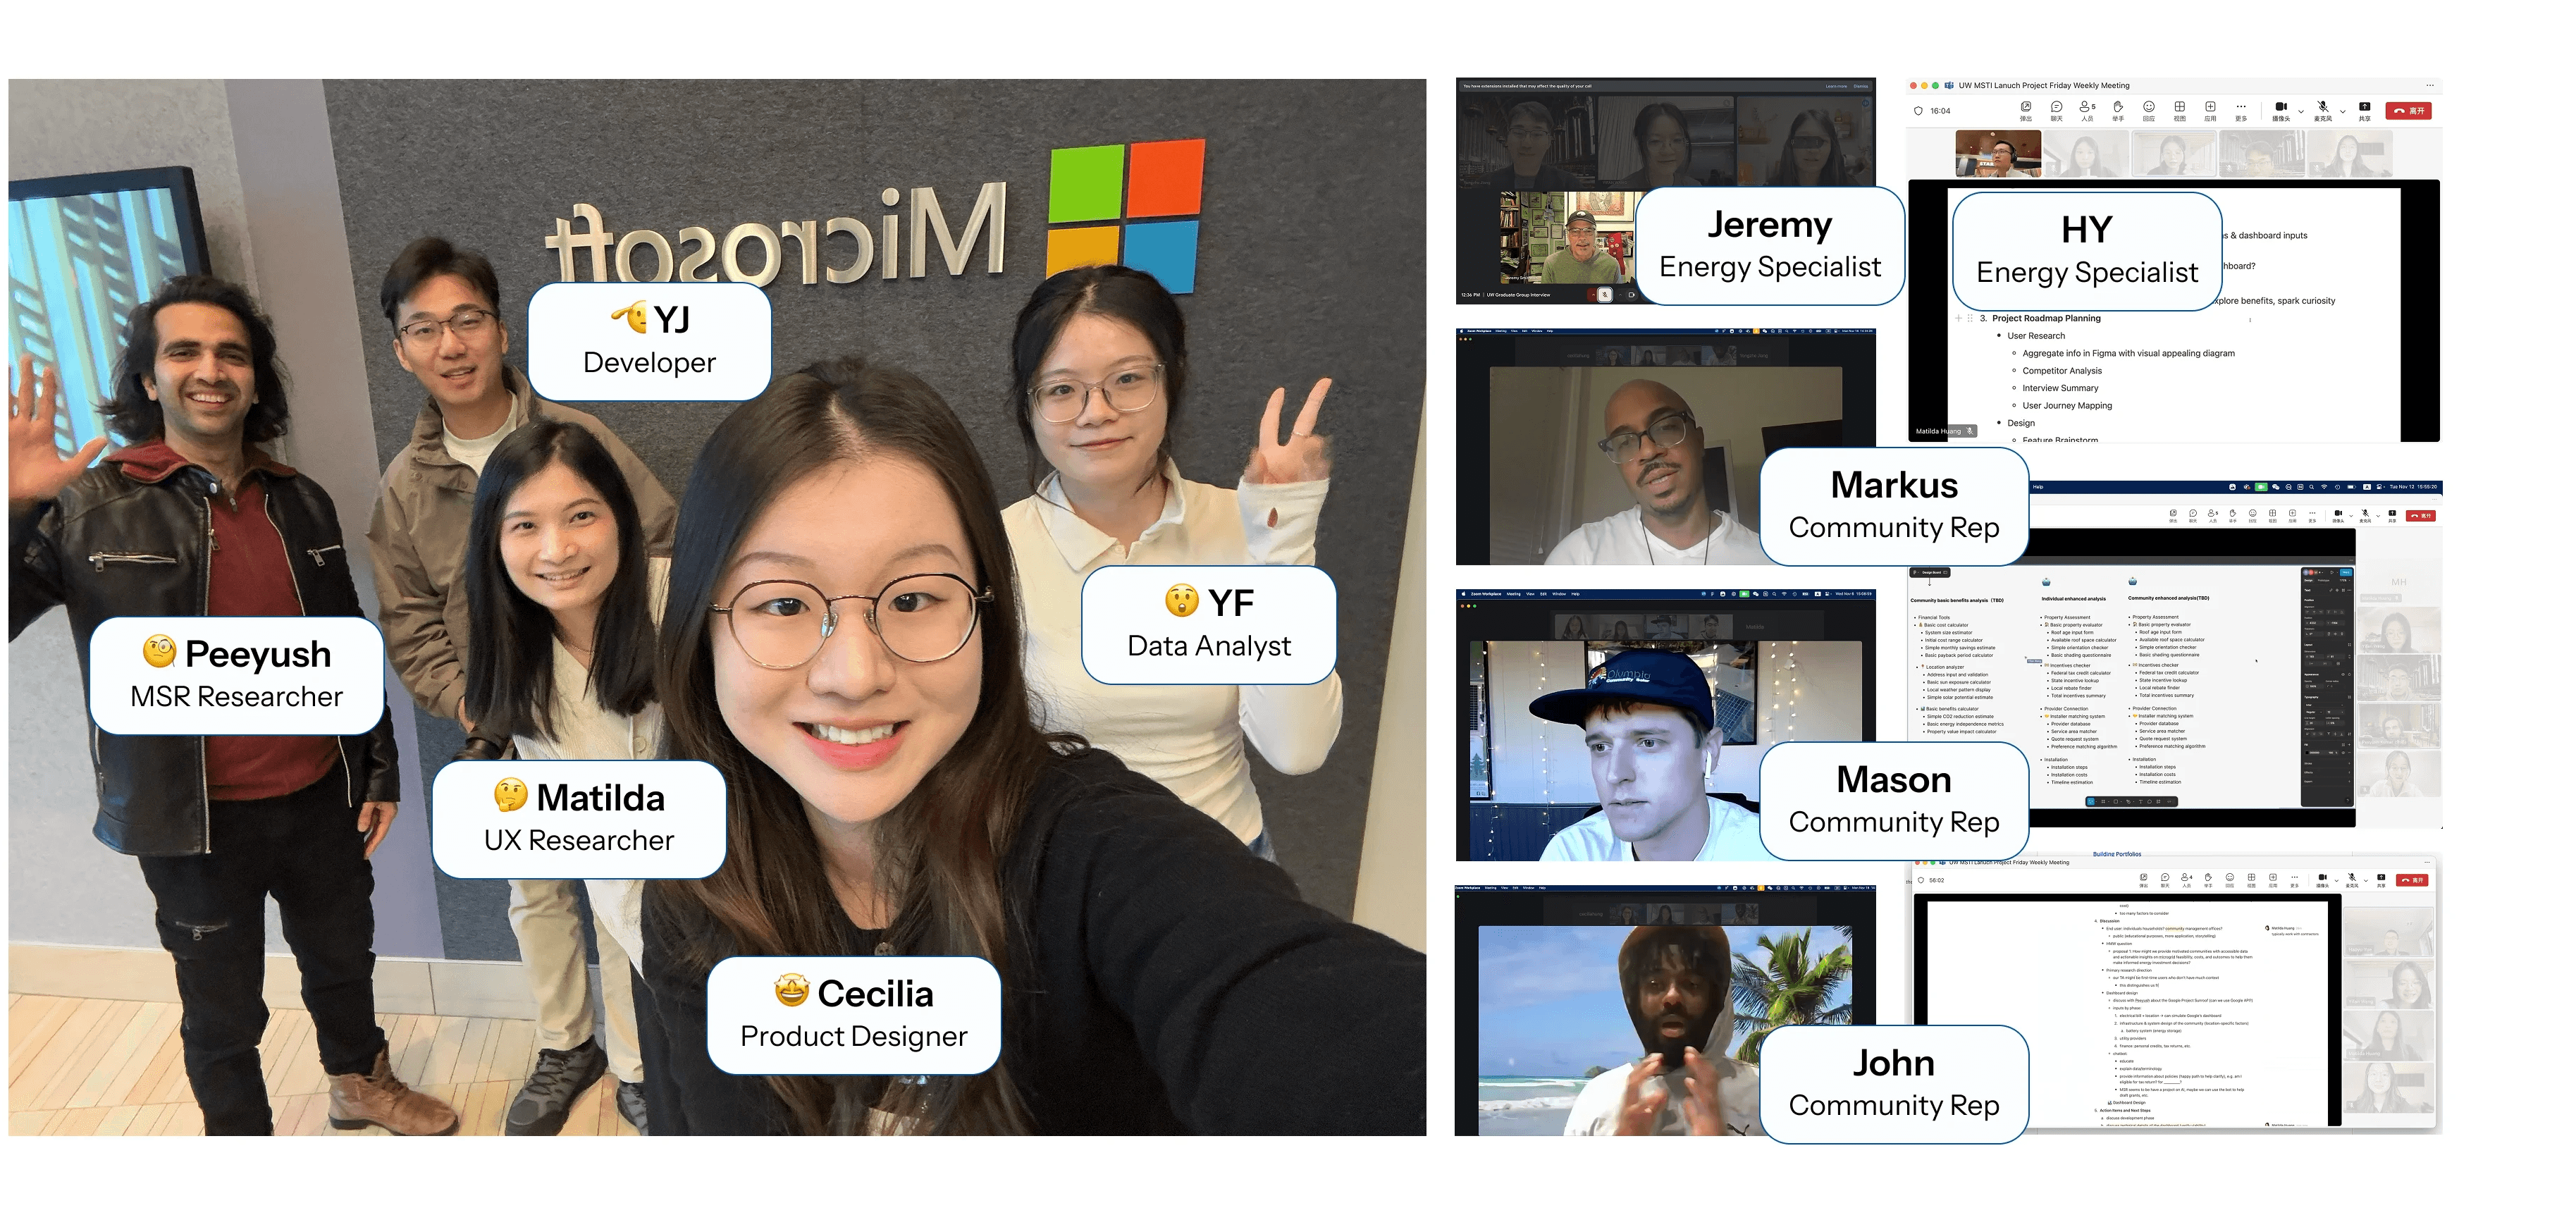
Team
1 Data Analyst, 1 Developer,
& 1 Researcher
Duration
6 months

Project Roadmap
The project roadmap outlines the short-term goal of establishing usability and credibility for adoption, while the long-term vision focuses on scaling through industry partnerships, potential monetization, and broader impact.

What is Solar Microgrid?
Solar microgrids scale up household solar systems to serve entire communities, enabling larger energy loads but also requiring higher costs and infrastructure.

We conducted an intensive competitive analysis and identified two mainstream tools in the market.
By comparing them with our target users’ needs, we found major shortcomings in usability and
personalization.

An AI-powered solar dashboard addresses key adoption barriers by making solar information more accessible, financial insights more personalized, and feasibility evaluation more actionable.

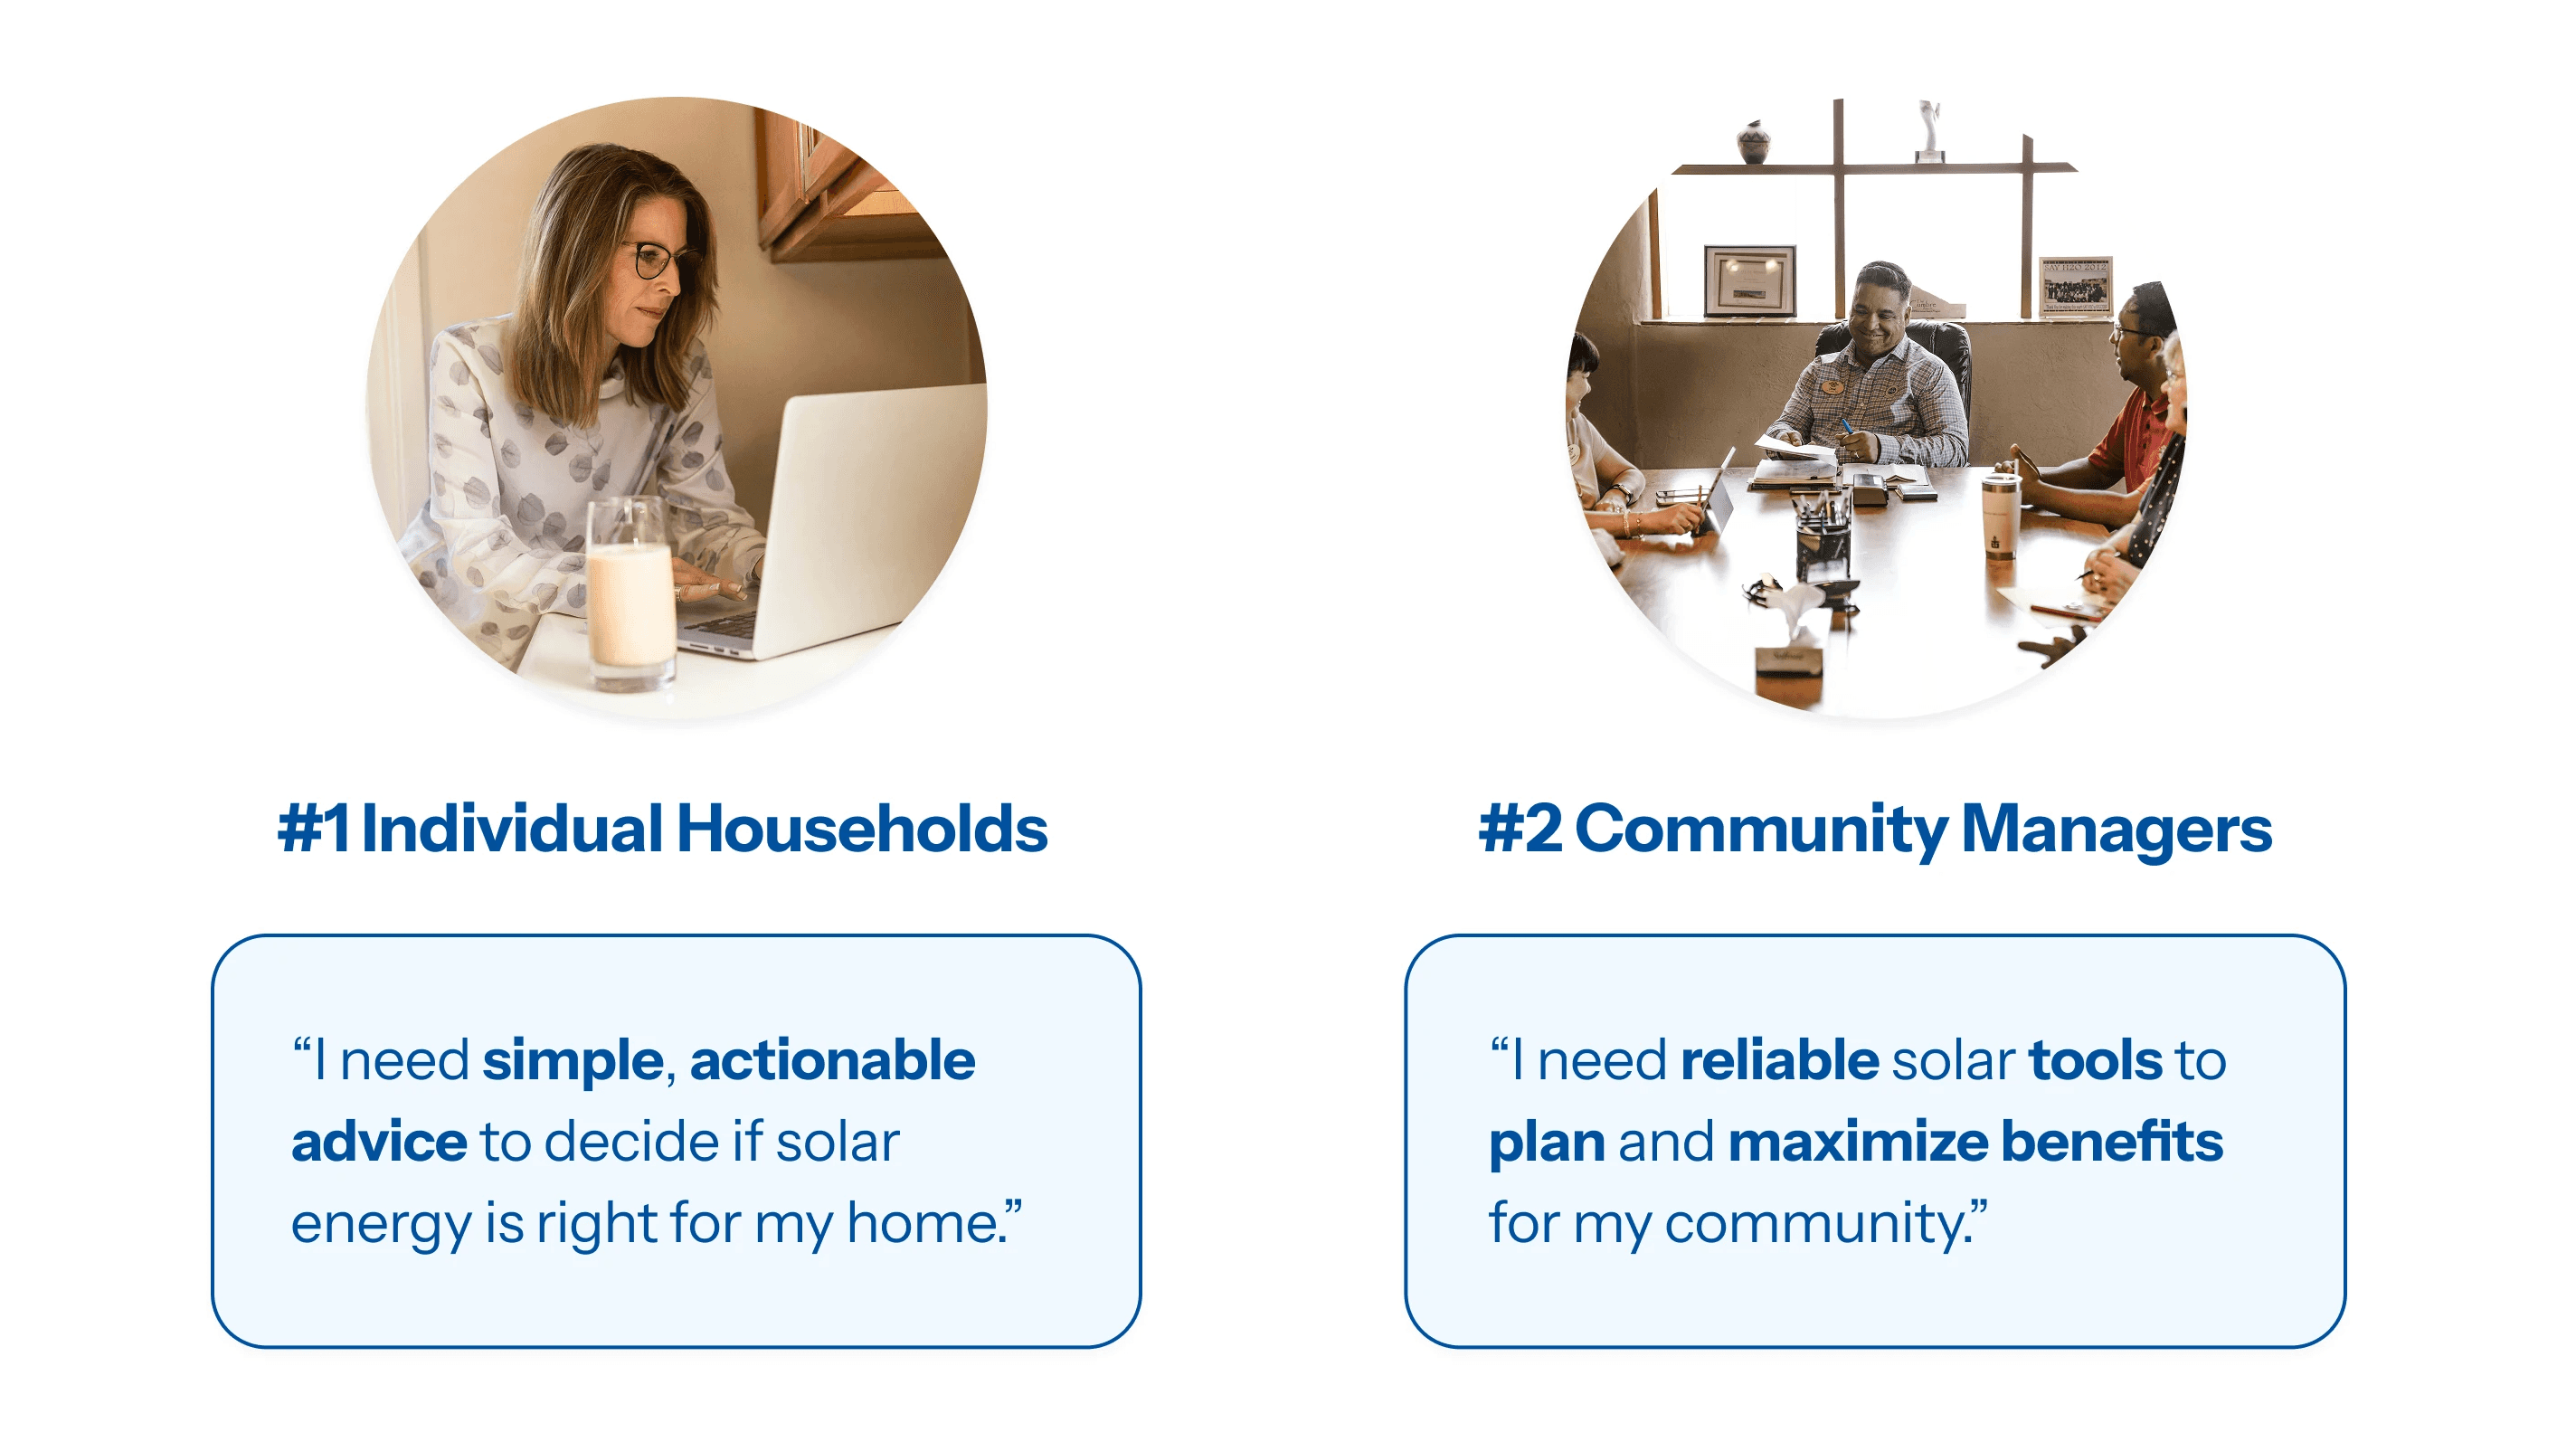
The dashboard serves two key user groups: individual households seeking simple, actionable guidance on solar adoption and community managers needing reliable tools to optimize solar benefits for their communities.
Research insights directly informed key features of the AI-powered dashboard, ensuring the design addressed user needs around personalization, education, financial clarity, and deeper support.

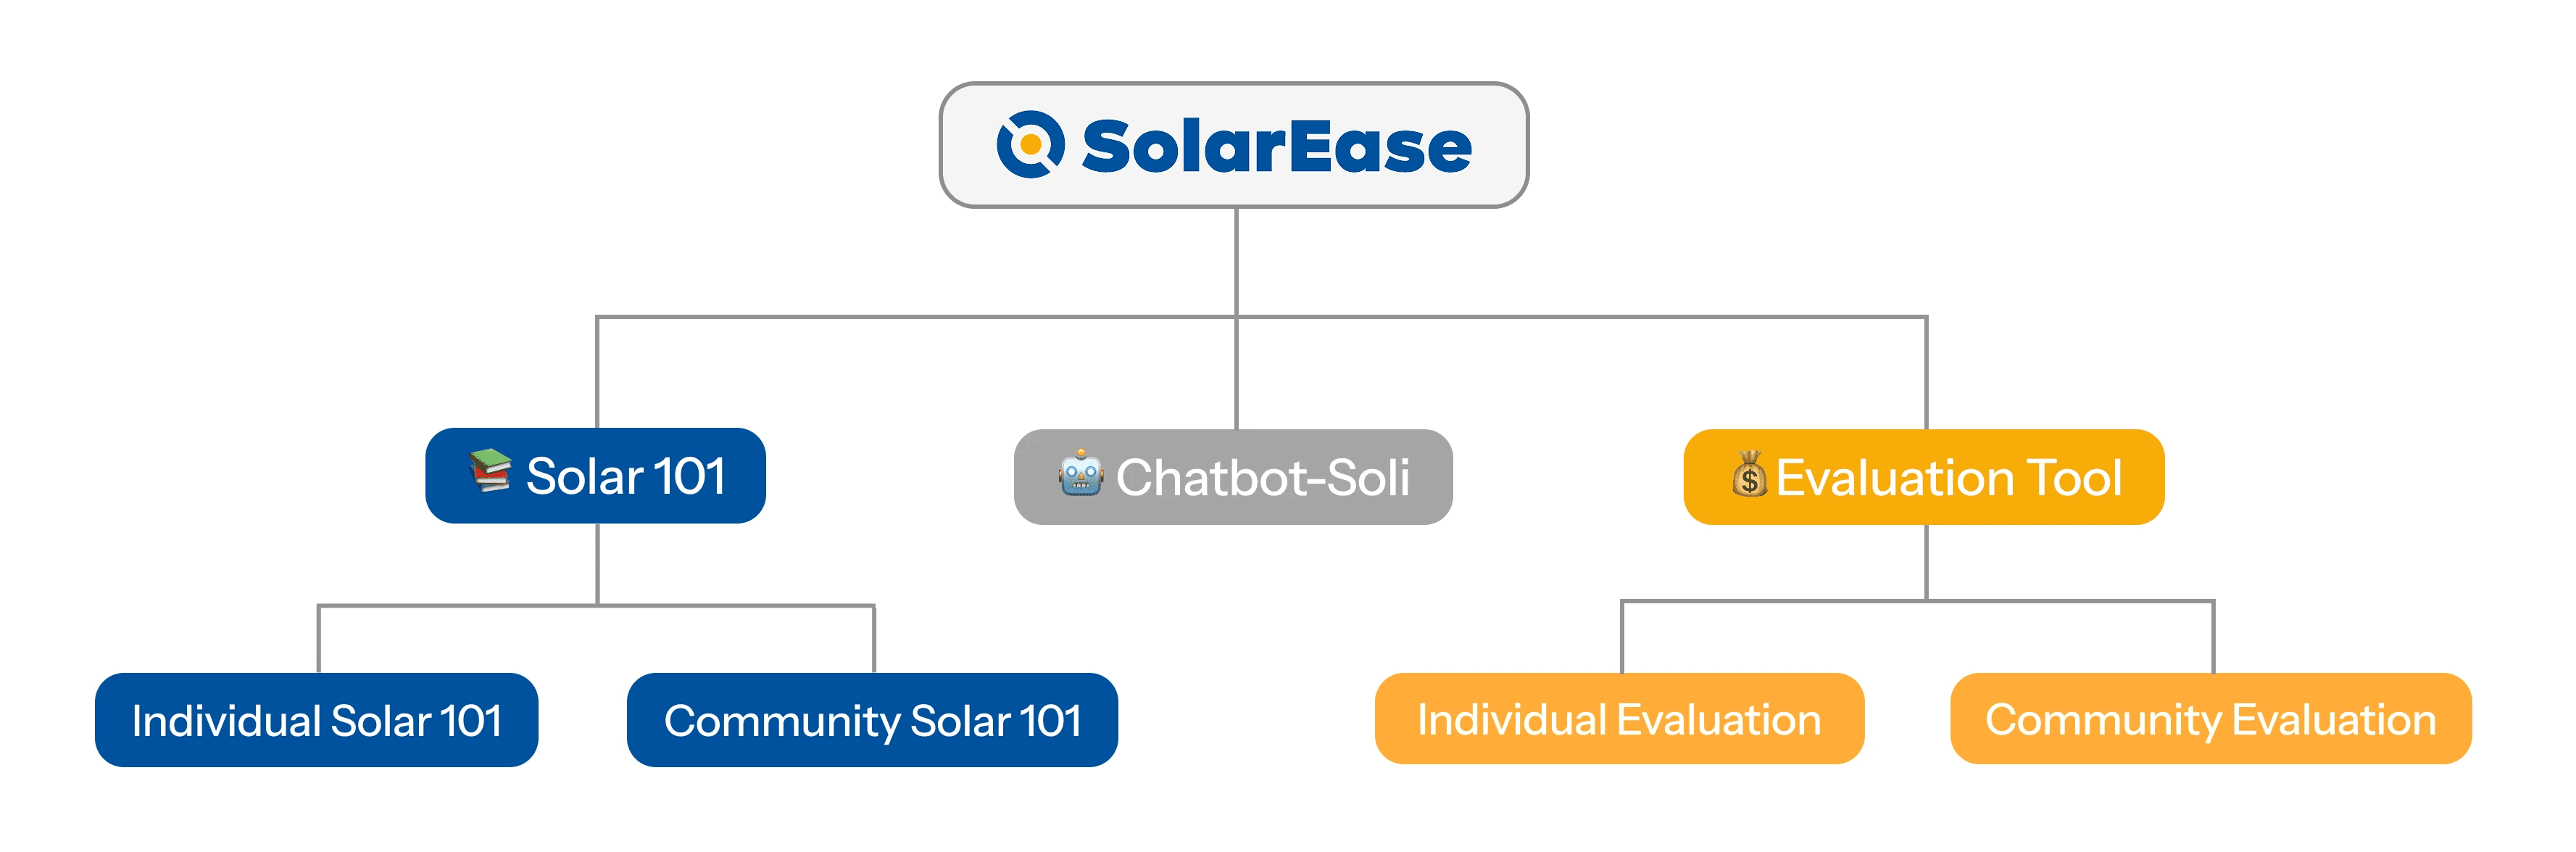
The SolarEase dashboard is organized into three core modules—Solar 101, Chatbot-Soli, and Evaluation Tool—each tailored for both individual and community solar needs.
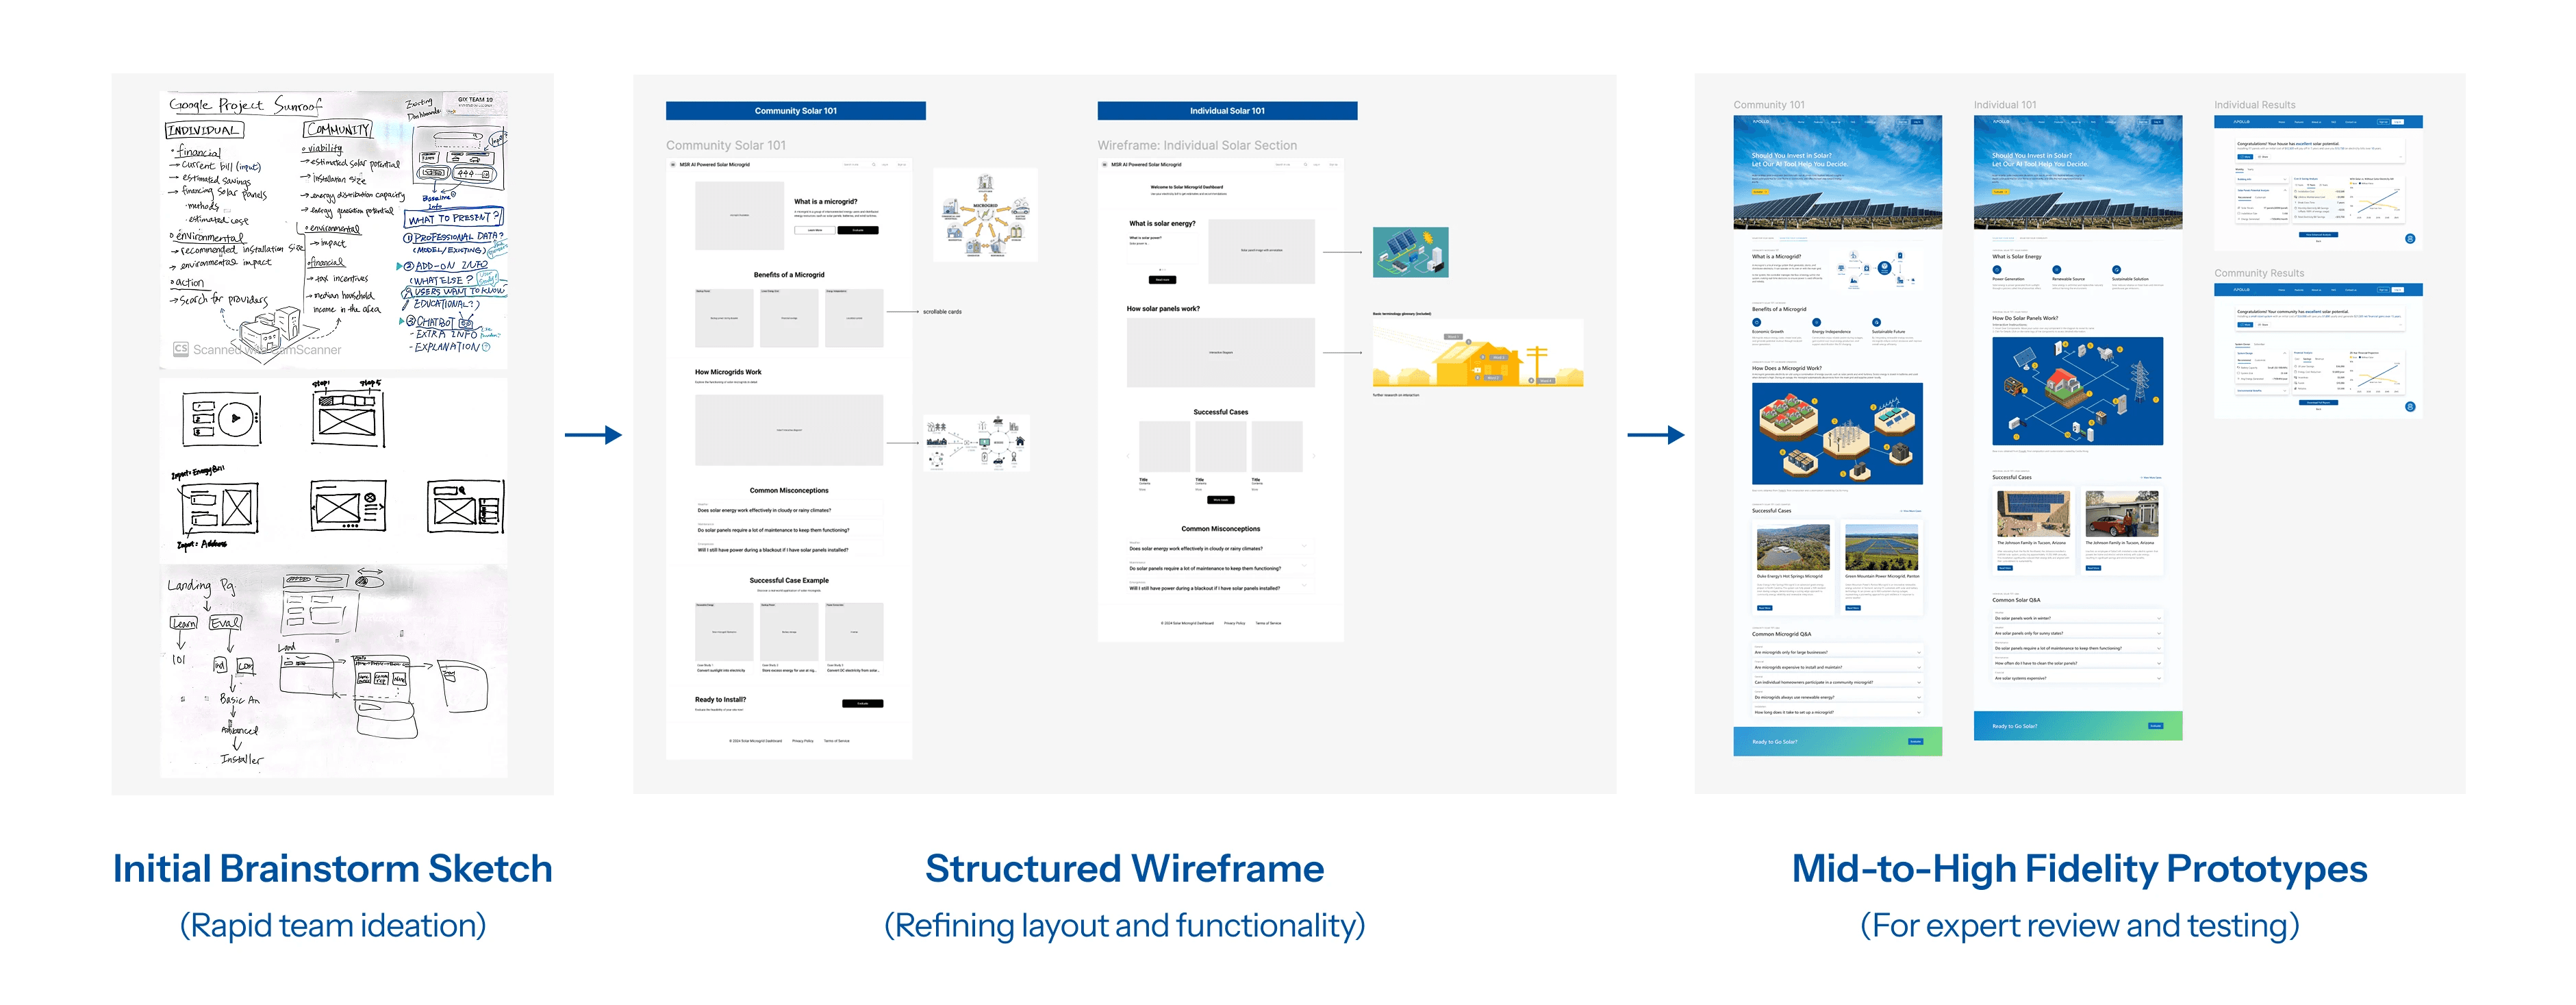
The design evolved from initial sketches to structured wireframes, then into mid- to high-fidelity prototypes, allowing for continuous refinement and expert feedback throughout the process.
The dashboard features an interactive solar diagram for education, an AI chatbot for localized guidance, and a financial evaluation tool to help users assess solar feasibility and savings.

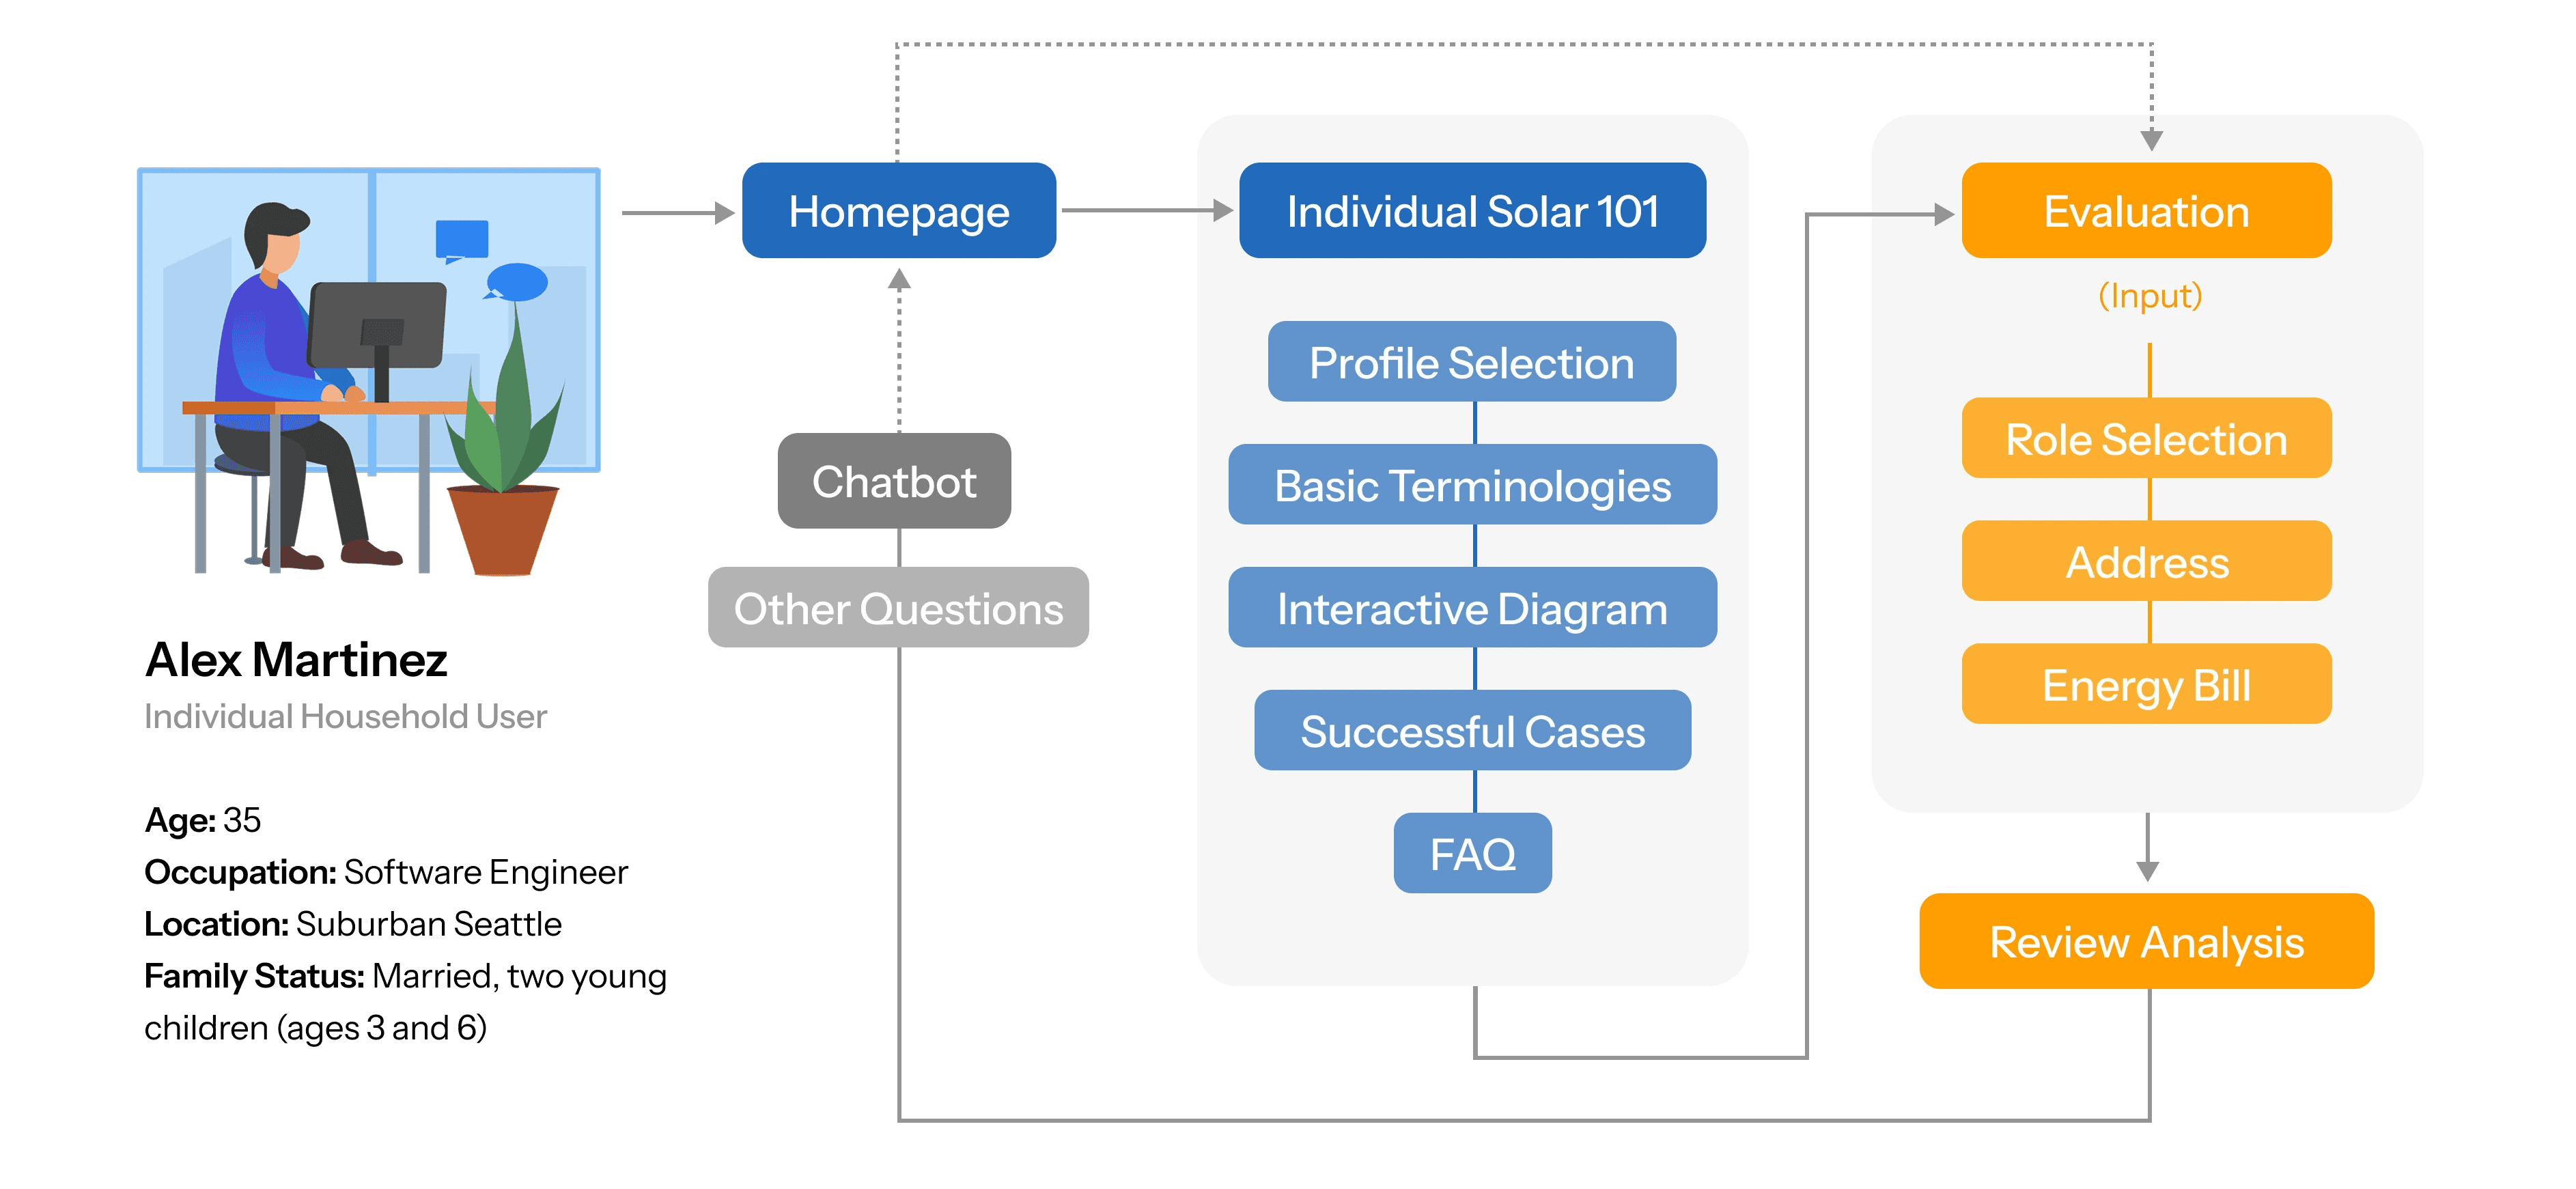
The user flow maps out how an individual like Alex navigates the dashboard—from learning solar basics to evaluating personal feasibility—supported by interactive tools and chatbot assistance.
Key design trade-offs balanced engagement, clarity, and innovation with professional credibility, development complexity, and project timelines—ensuring core features stayed focused and feasible.

The interface adopts Microsoft’s Fluent 2 Design System for accessibility, paired with a blue-and-yellow palette to reflect solar energy, warmth, and trust.

Solar 101
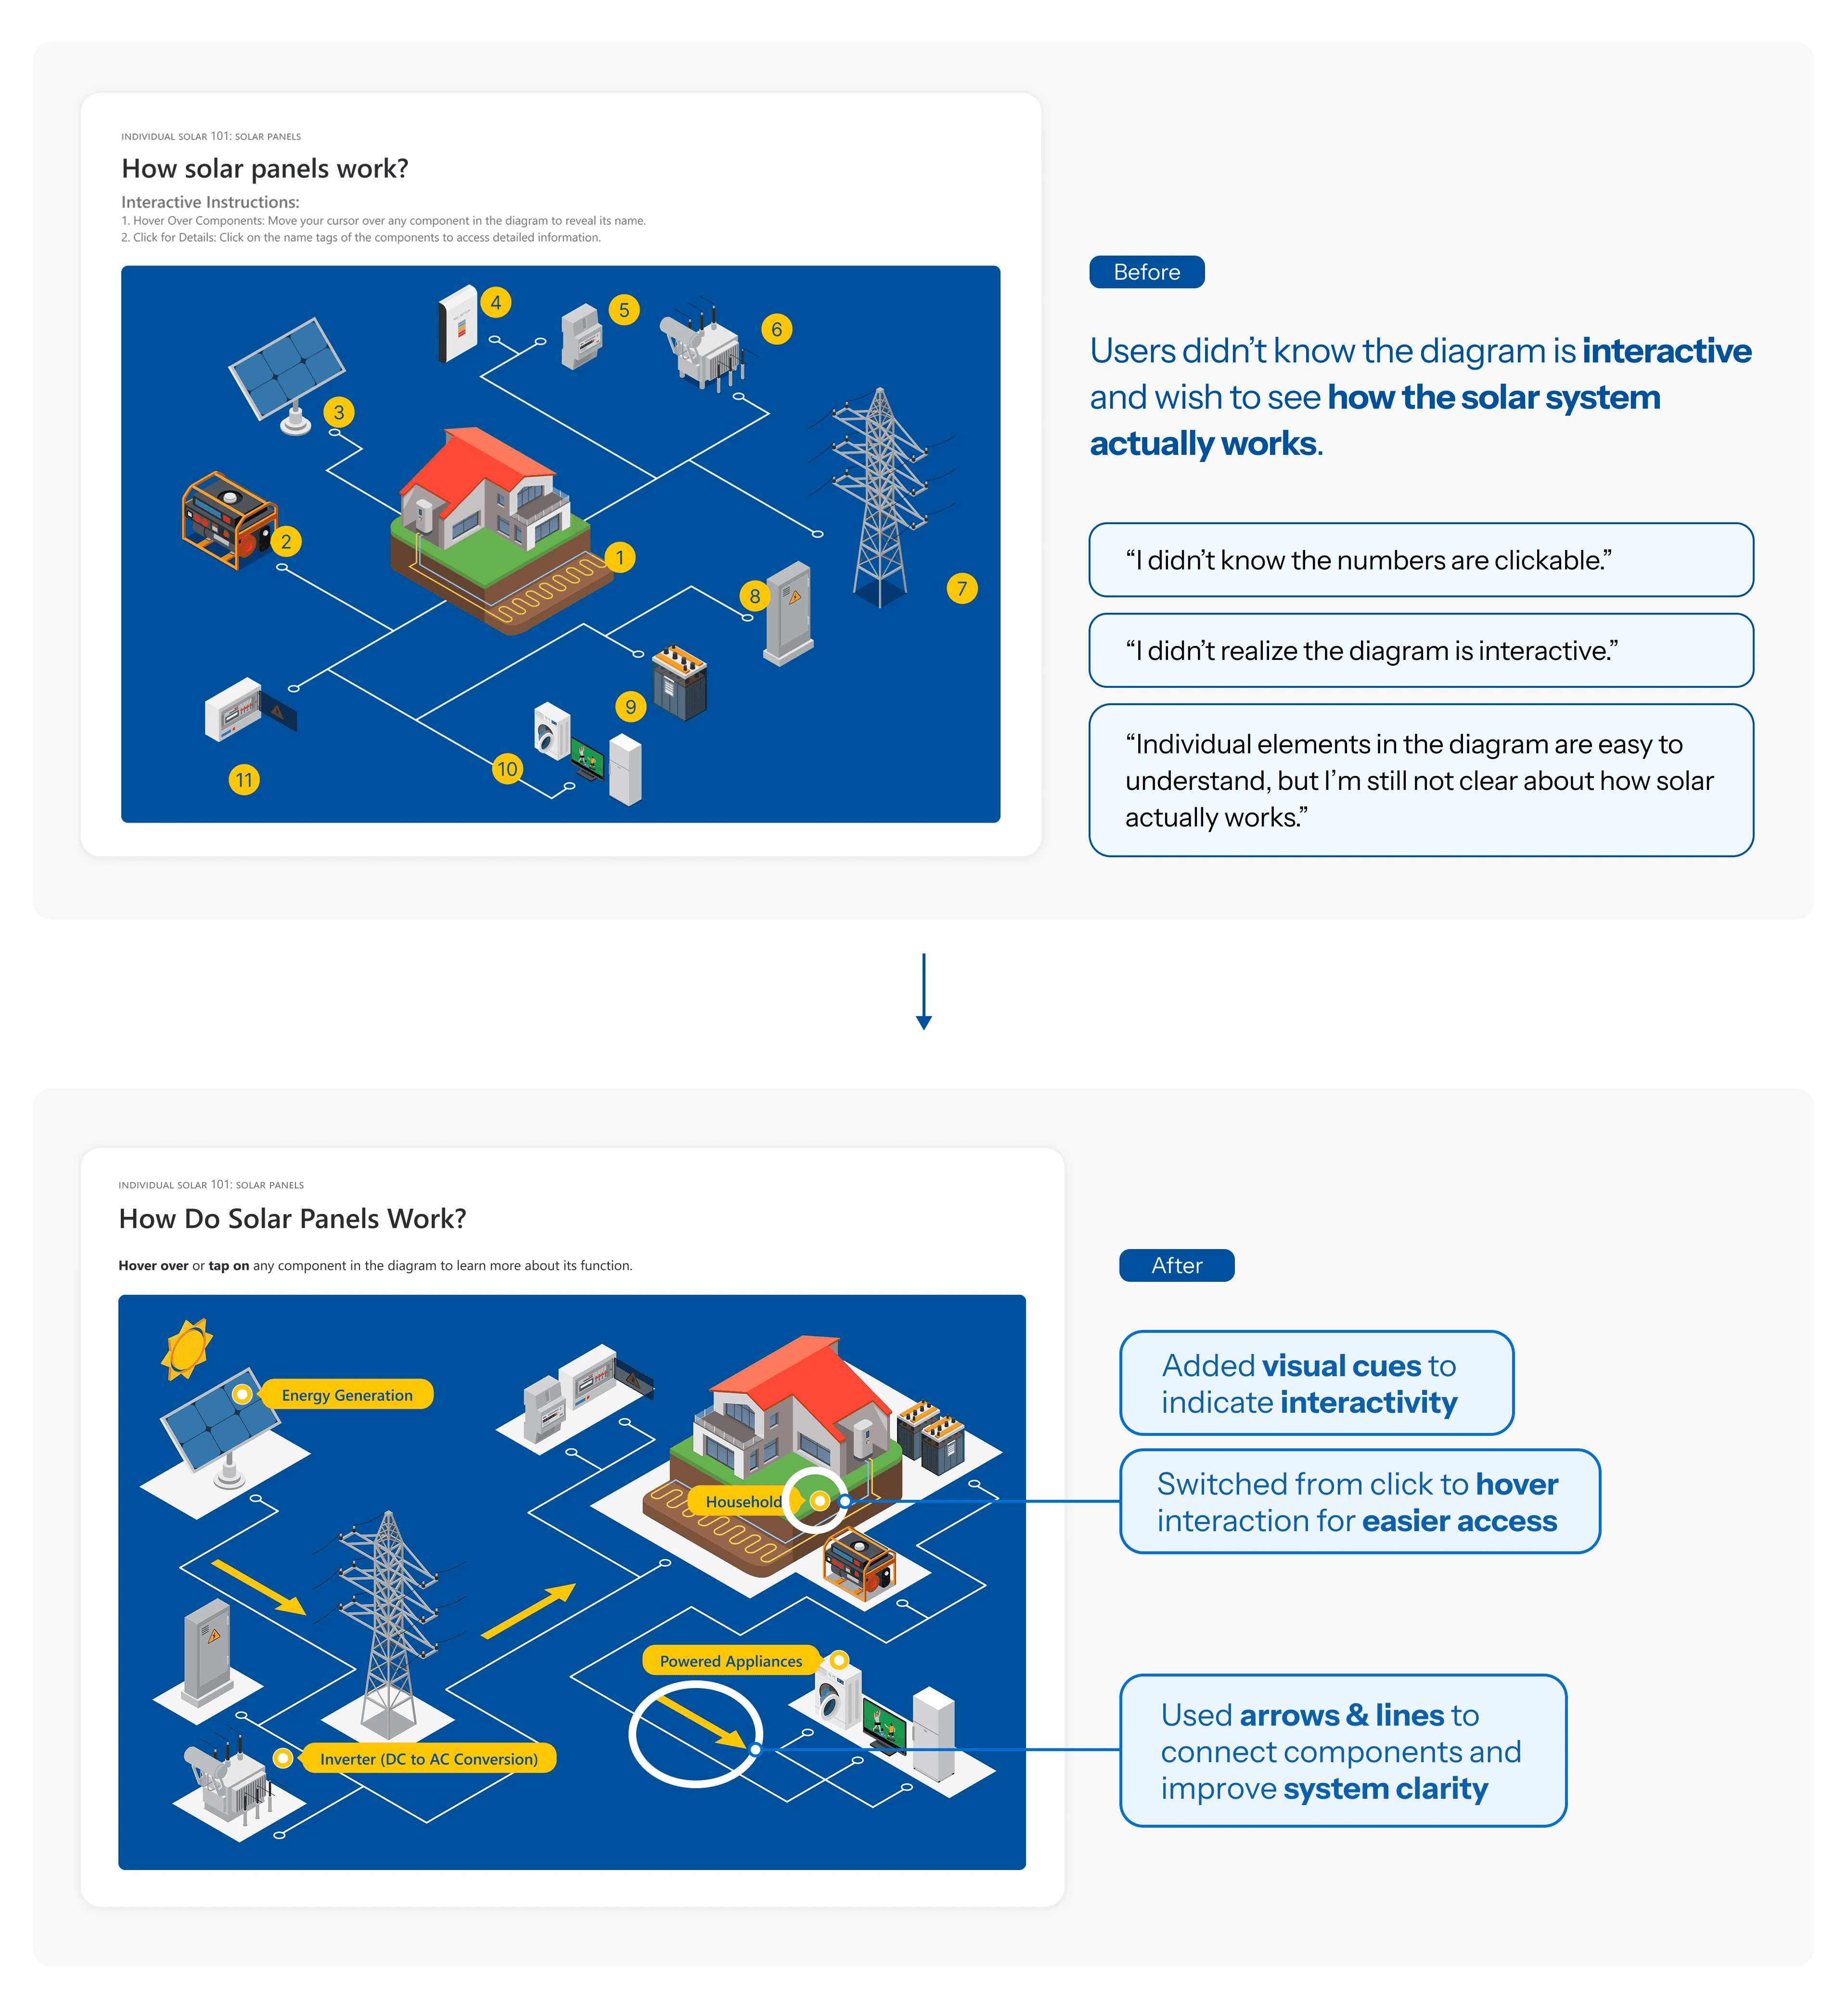
This interactive diagram visually guides users through the solar energy process—offering hover-based details to support intuitive, self-paced learning.

Integrated
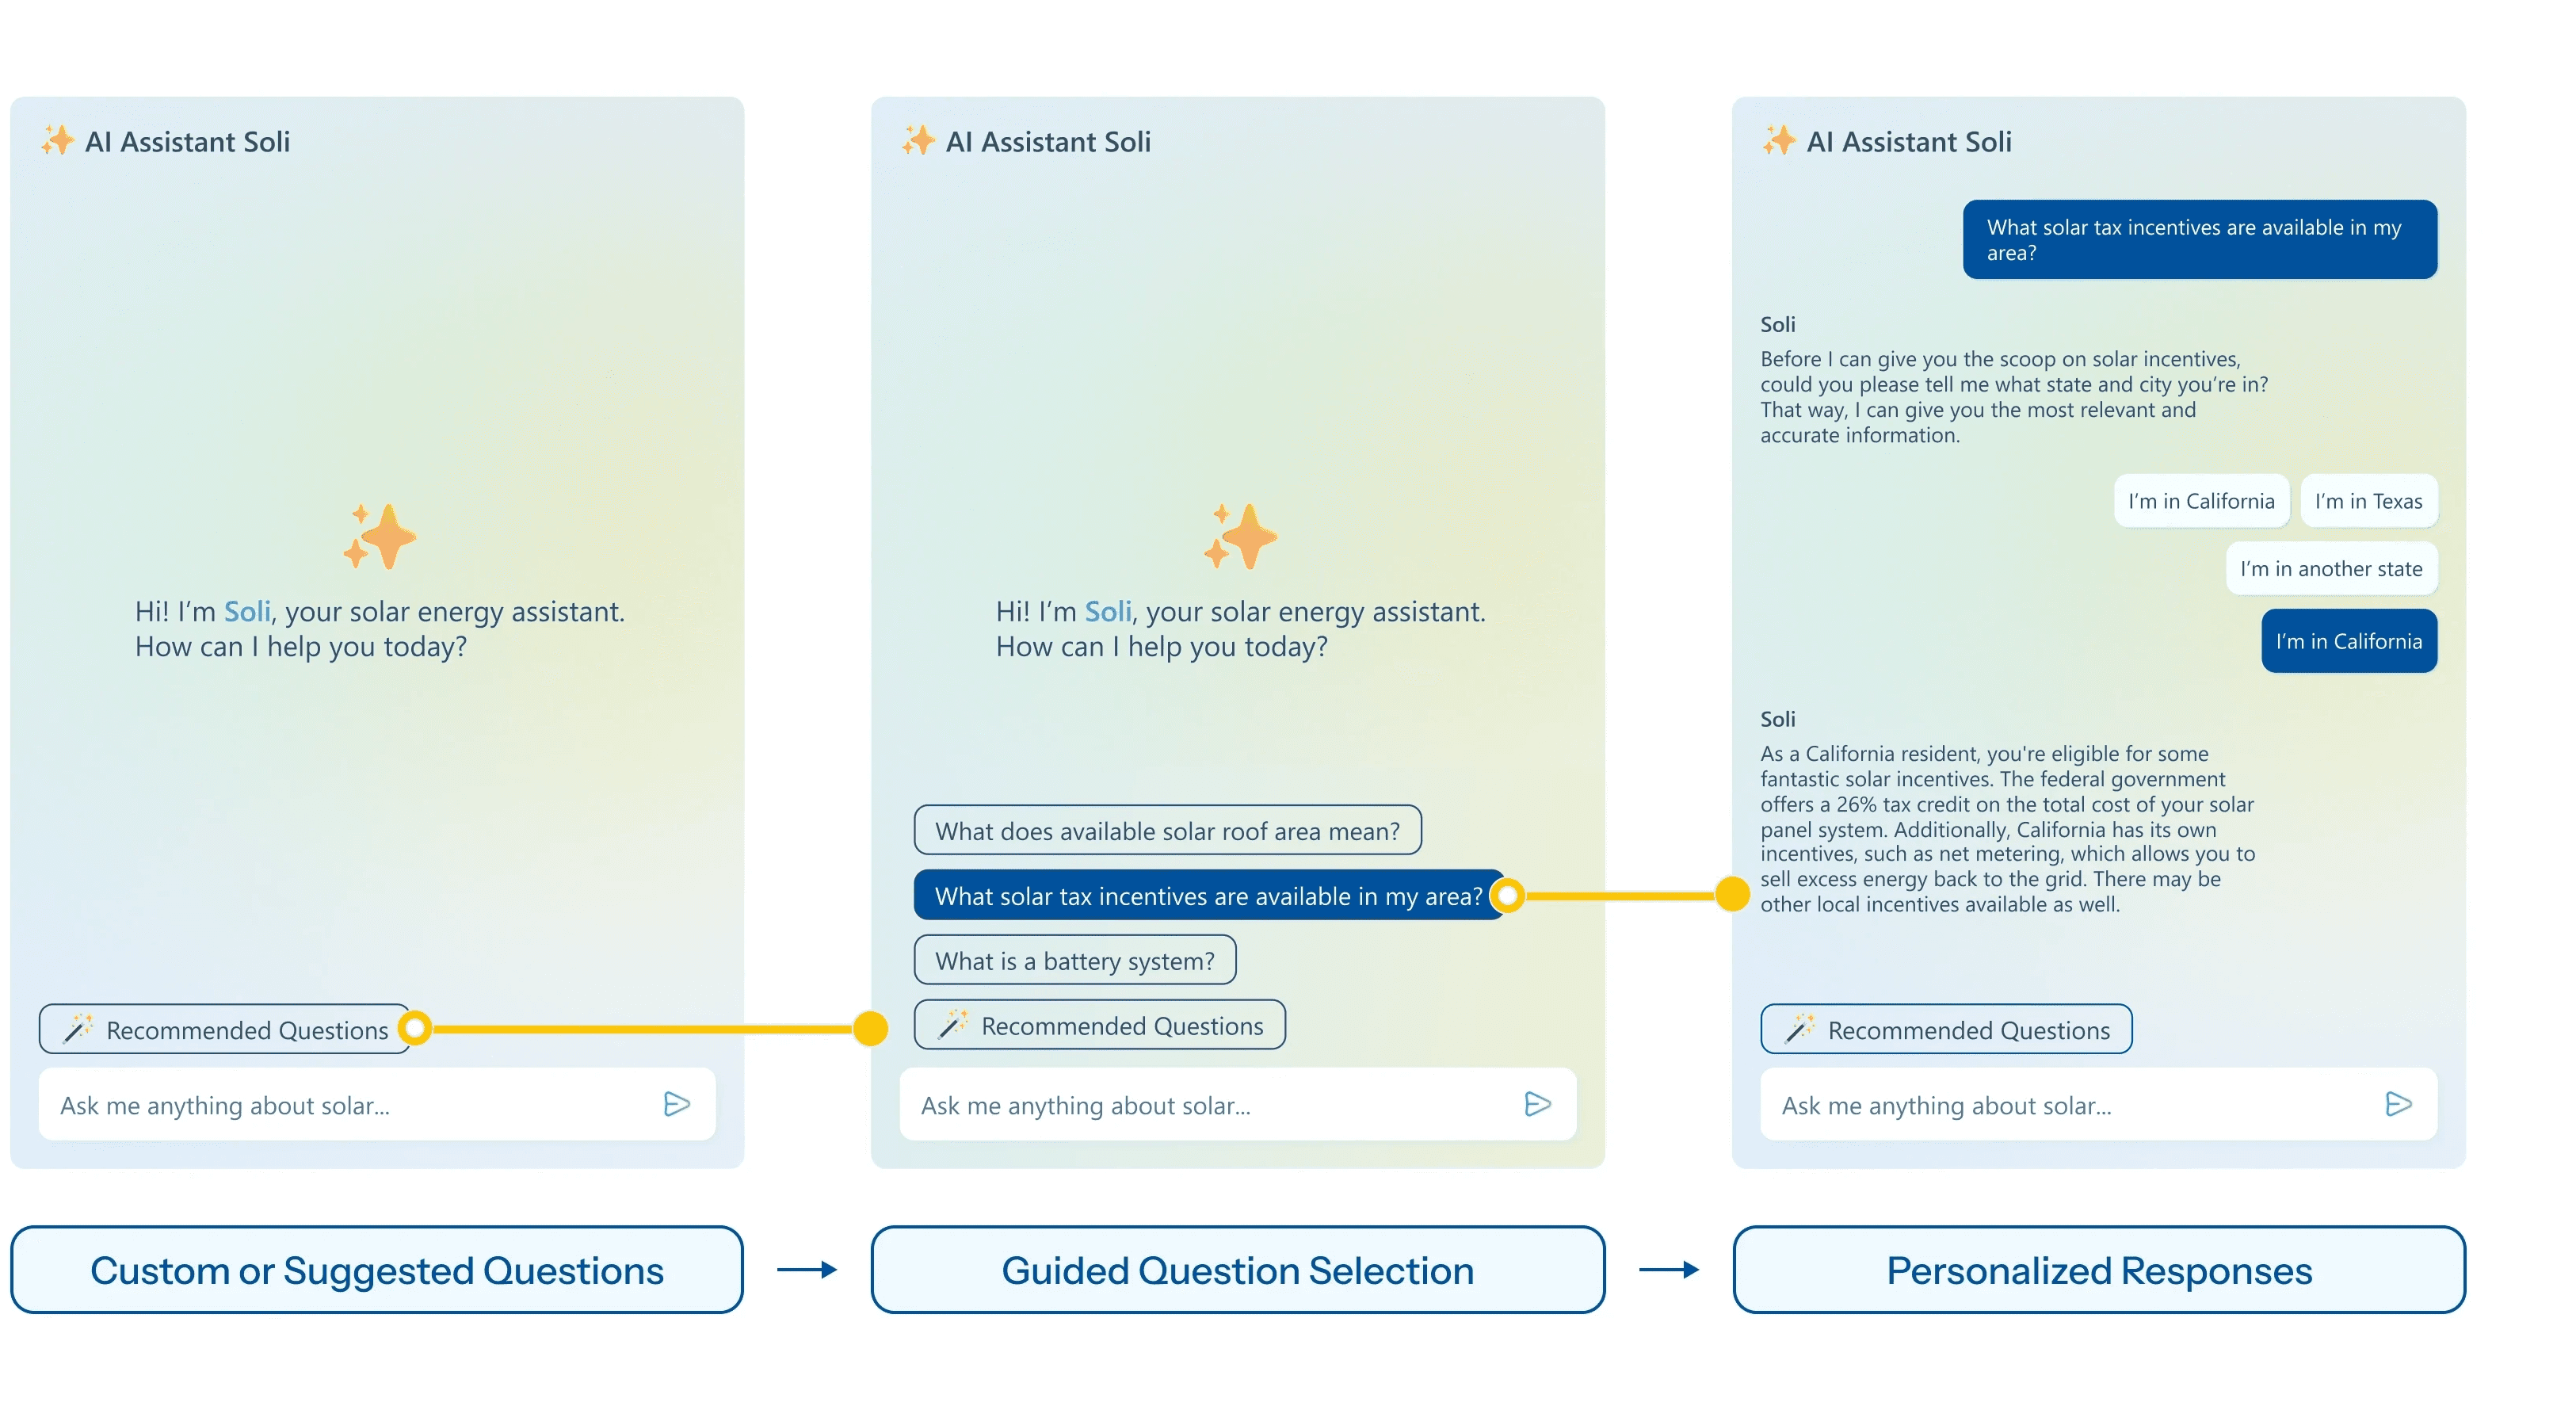
The AI Solar Chatbot guides users through custom or suggested questions, delivering localized, personalized answers to support informed solar decisions.
Evaluation Tool
The financial report provides users with personalized solar savings analysis, tax incentives, installation feasibility, and sharable insights to support confident decision-making.

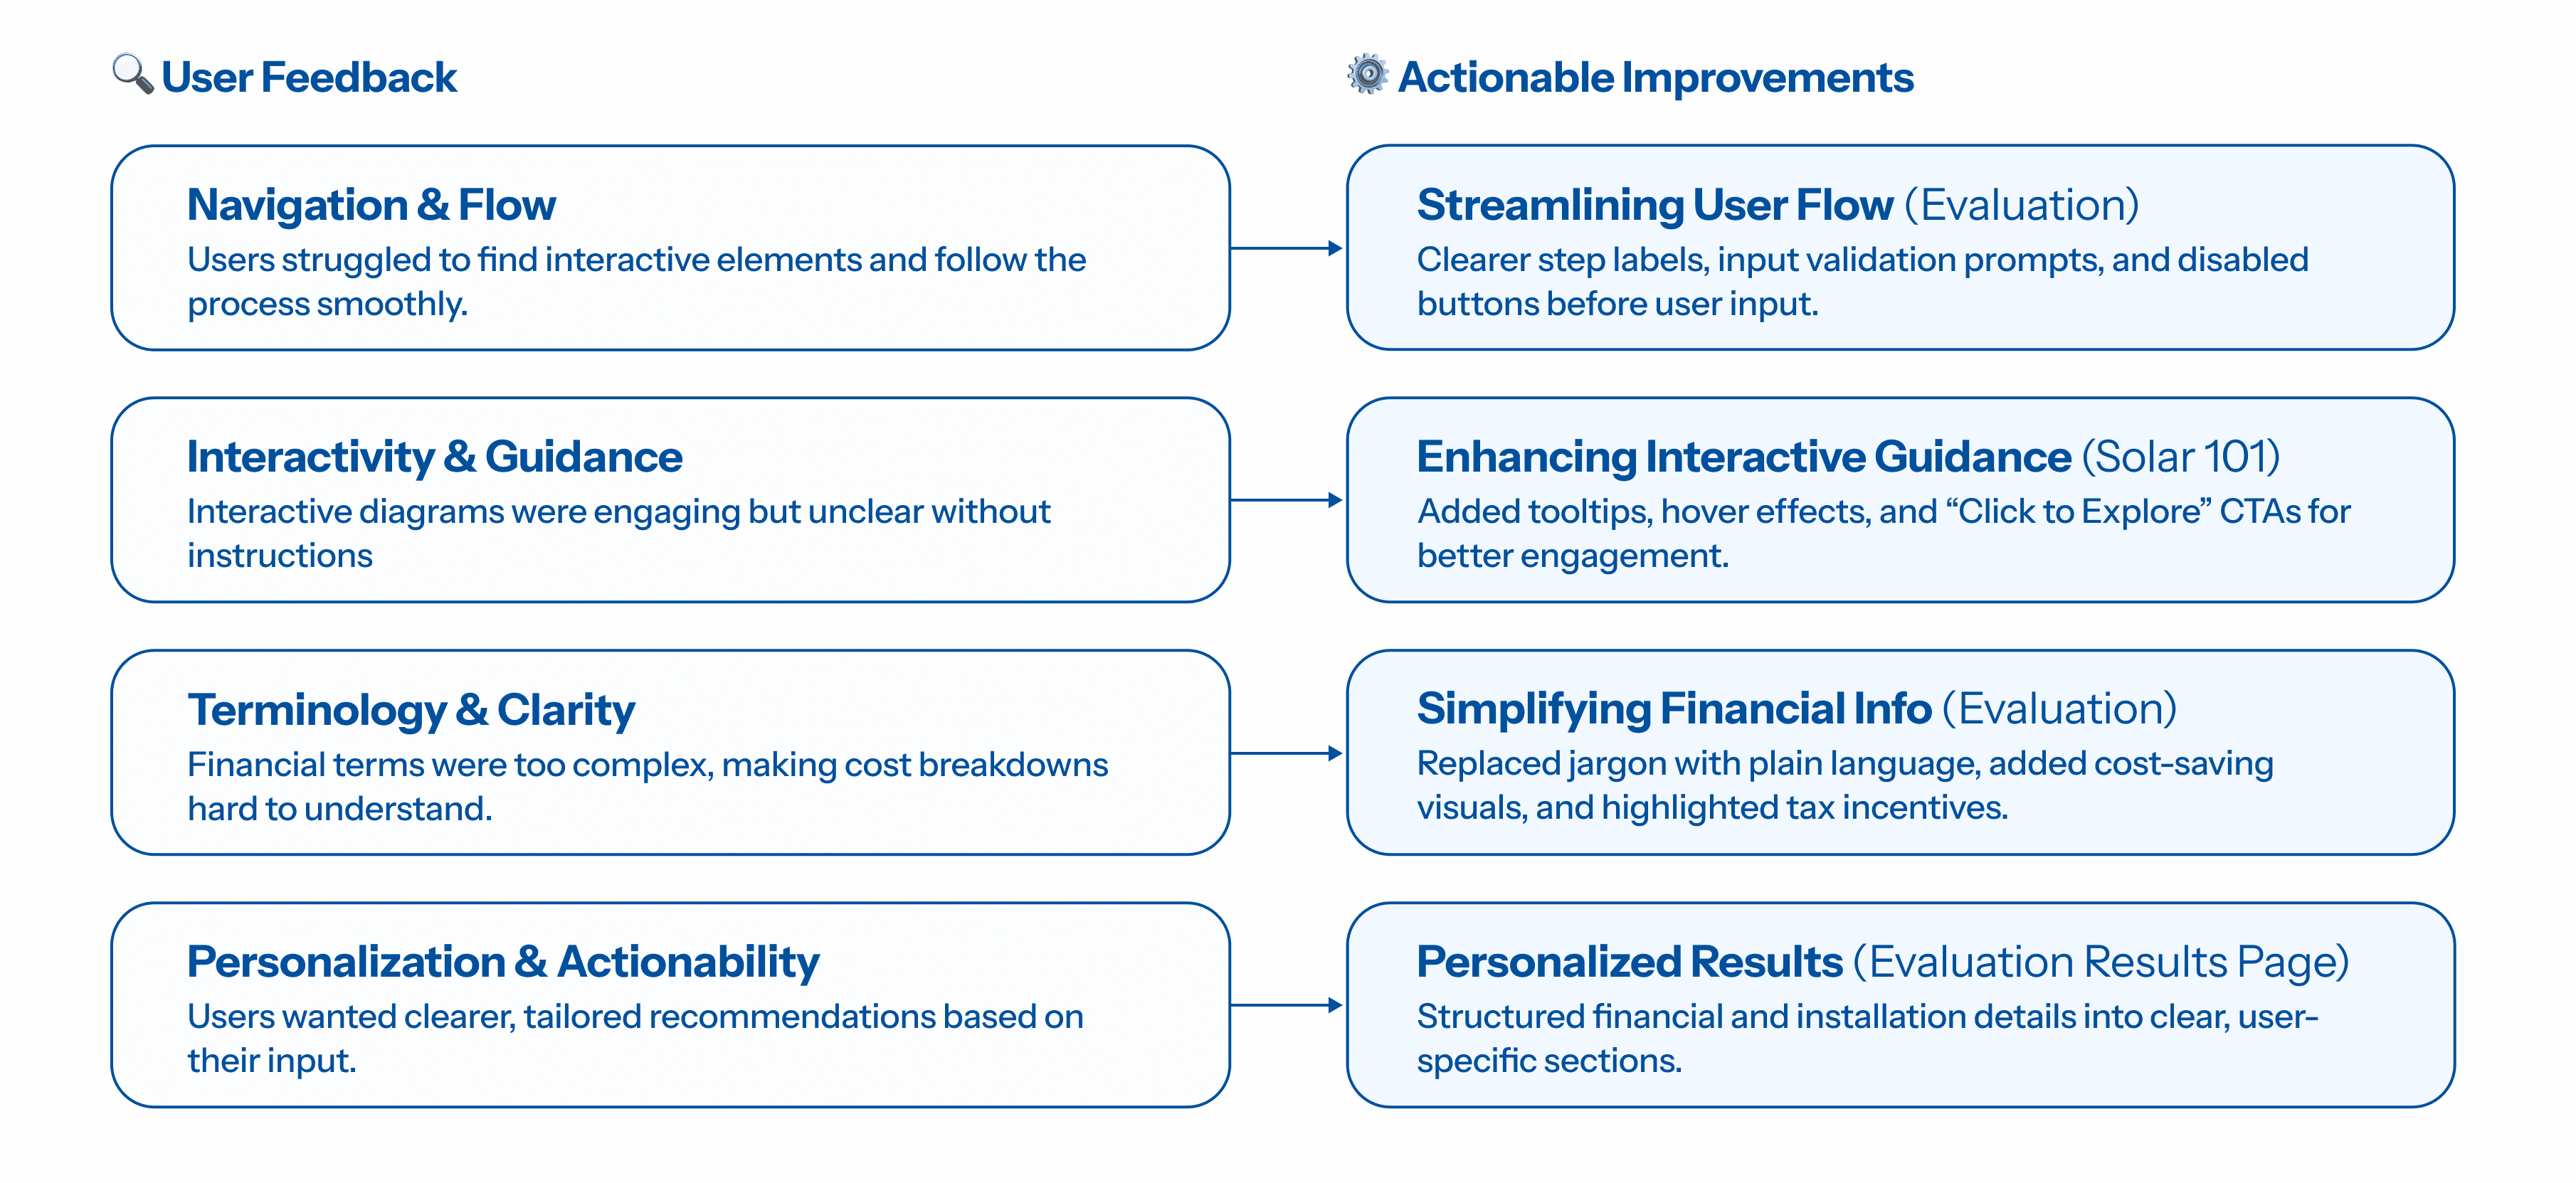
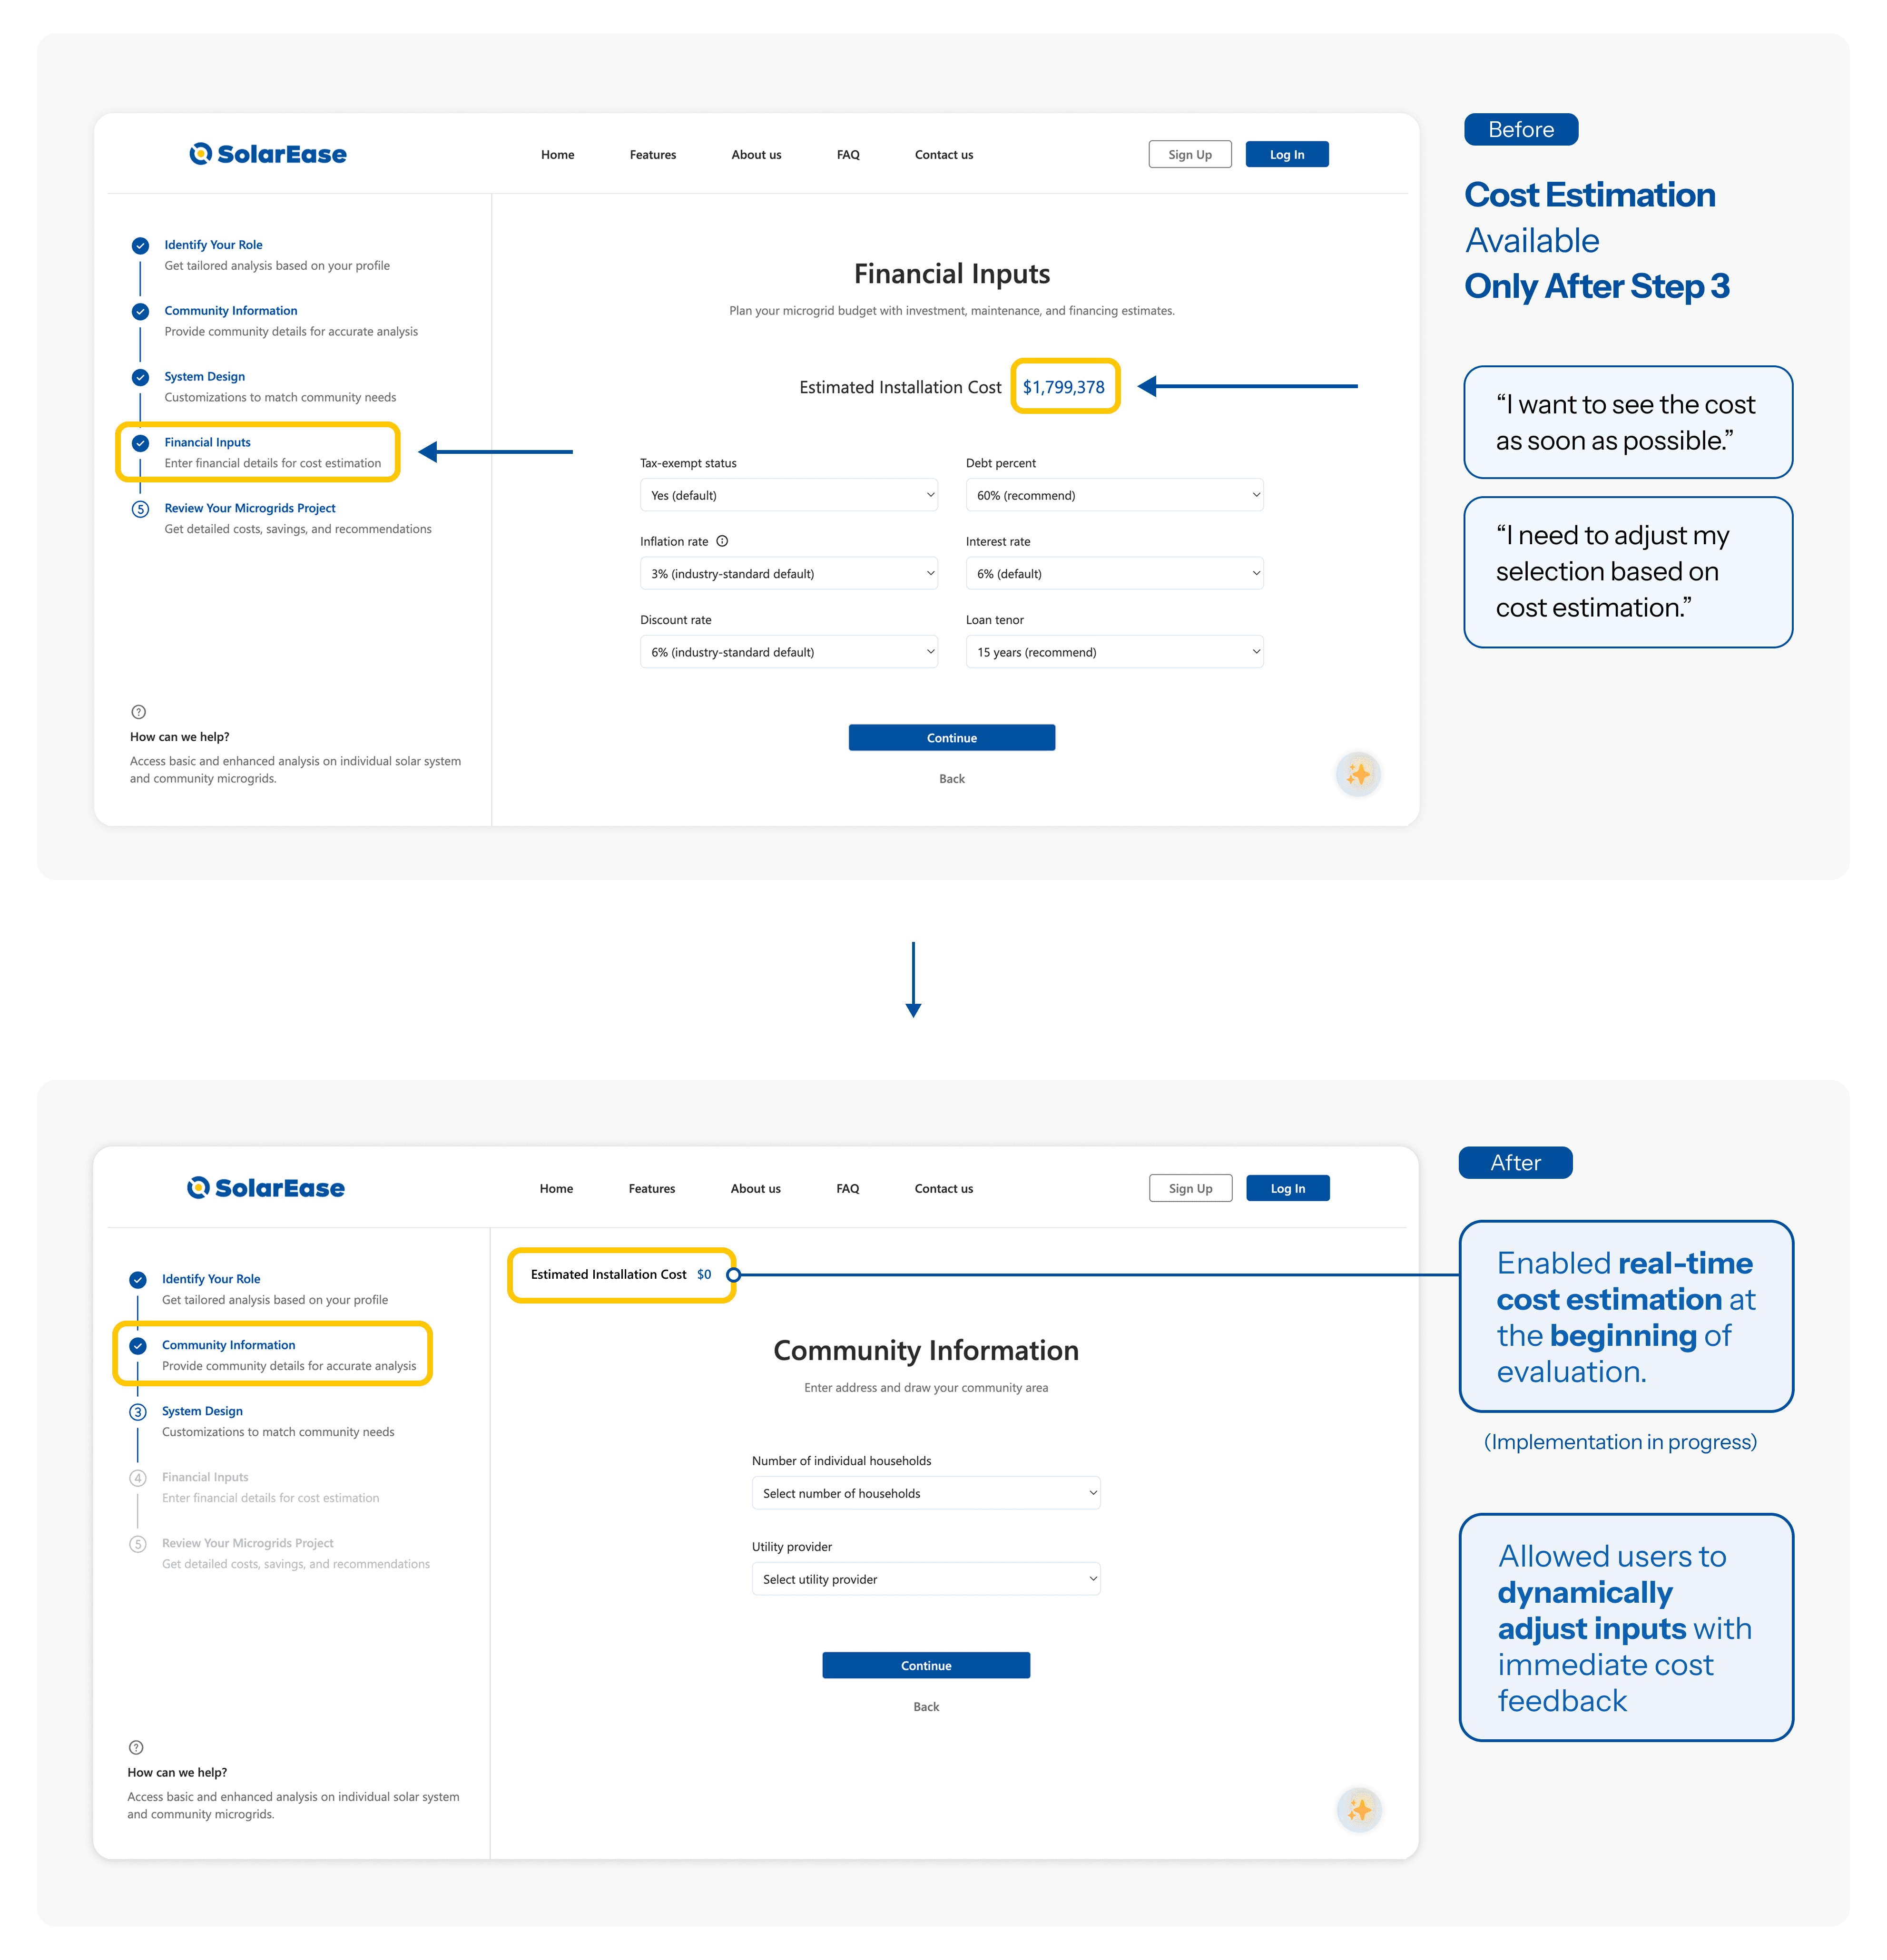
User feedback guided improvements across flow, clarity, interactivity, and personalization—ensuring a smoother, more intuitive experience from learning to evaluation.
Solar 101
Evaluation Tool
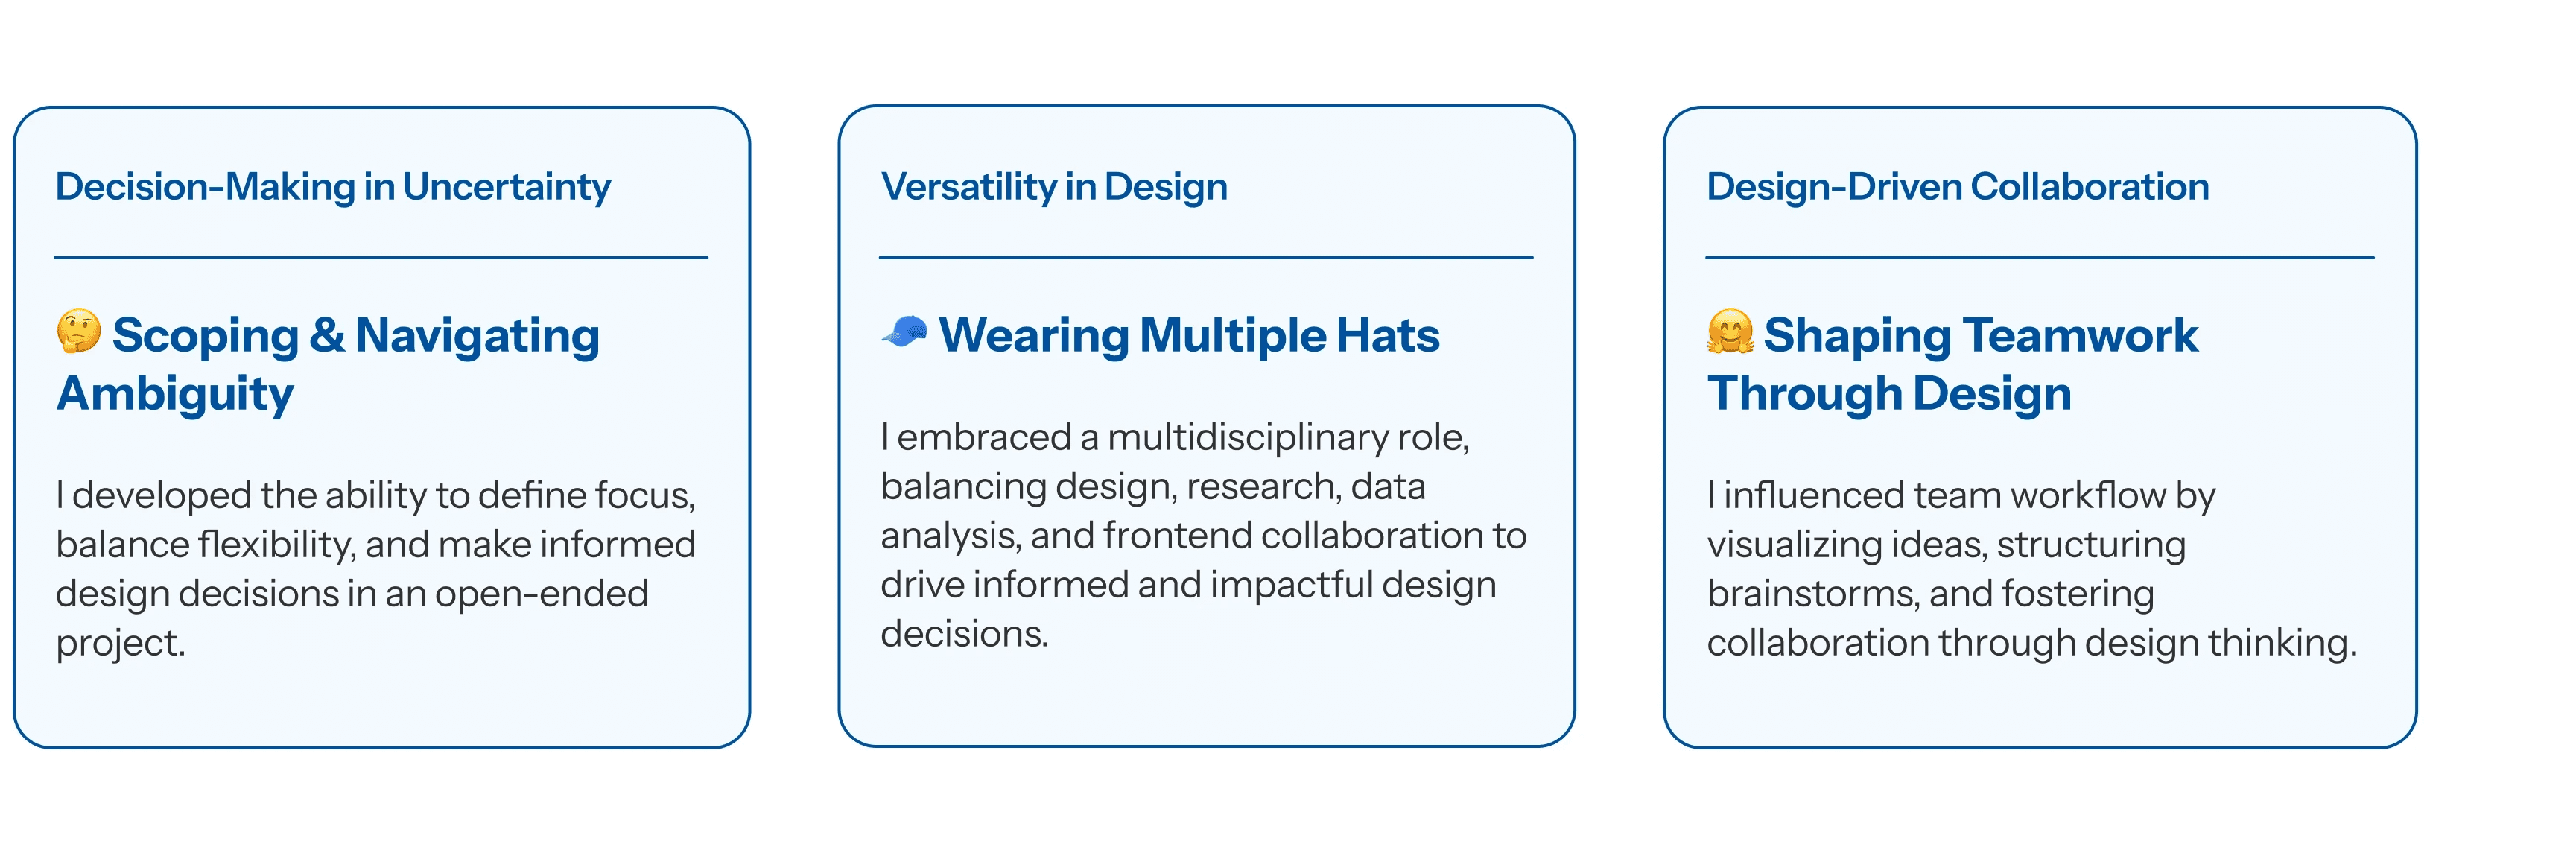
This project strengthened my ability to navigate ambiguity, take on versatile roles, and drive collaborative teamwork through design-led thinking.
Team collaboration was at the heart of this project—our shared design process was strengthened by open communication, cross-functional contributions, and a spirit of collective problem-solving.